Principal Salaries: Incremental Change Continues
By Theresa Kelly Gegen
Principal and other administrator salaries from 2018 to 2020 are reviewed here to complete the semi-annual entry into the Journal’s administrator salaries series.
The data, published annually by the Illinois State Board of Education (ISBE), are publicly available (except when being updated). For the purposes of this administrator salaries series, the data include the base-plus salaries, which means salaries and the monetary benefits listed under bonus, annuities, retirement benefits, and other benefits. It includes those with full-time equivalents of 0.9 or higher. We break this down further in this installment into principals, assistant principals, and other administrators. The January/February issue of the Illinois School Board Journal addressed superintendent salaries. The full series is available online.
The Numbers
Compared to superintendents, there are more principals (see Table 1), and also historically more fluctuation in the salaries and related data. Factors involved in that over time include attrition, mobility (especially because principals more often move into superintendent roles than vice versa), and prominent regional differences. A factor of more recent impact is the coronavirus pandemic, which has impacted an ongoing educator shortage that was already considered a crisis.
The 2021 Illinois Educator Shortage Survey report published by the Illinois Association of Regional Superintendents of Schools noted that over a third of school districts reported administrator shortages, with 35% of superintendents in responding districts reporting a moderate to severe problem. Over half (54%) expect minor to severe administrator shortages next year.
Typically, salaries for administrators in Illinois public schools increase by 2-3% a year, and that held true from 2018 to 2020 (see Table 2). The percentage increase for principals did drop, from 2.6% to 1.8%. Across the data, changes like that are usually attributable to the collective impact of retirement or promotion, and diving into the data shows this to be the case here. A look at the high salary ranges in that category offers further explanation. Although there are more principal salaries reported in 2020 than in 2019, fewer individual principals had base-plus salaries over $200,000 and the high salary declined by $10,000.
Looking at the percentiles (see Table 3), the principal salaries at the upper percentiles are distancing themselves from the median more than the lower percentiles, but overall, the numbers show salaries drawing closer to the median from 2018 to 2020.
The percent change for assistant principals was nearly the same for the years in question, and the changes in percentiles are also consistent over time.
Other Duties as Assigned
This analysis includes, for the first time, a group known hereafter as “other administrators.” These are administrators who, to the extent that the data indicates, are school business officials, directors of special education, and/or hold administrator endorsements but are not superintendents, assistant superintendents, principals, or assistant principals. There are fewer “others” than principals, but more “others” than assistant principals or superintendents.
It’s a quirky category because it depends on the district’s input. If a district’s chief school business official is listed as an assistant superintendent, for example, they would have been included in the superintendent analysis.
Applying those criteria, the number of other administrators in the state has been fairly steady over the three-year span, with a high of 2,362 in 2018. The average salaries for these individuals statewide increased from $127,432 in 2018 to $134, 497 in 2020. Even without CPS, the Northeast Region of the state dominates this category. In 2020, the Northeast was home to 81% (1,855 of 2,291) of the other administrators and had the highest and lowest salaries in the category. In this category, the average salary in the Northeast in 2020 was $139,764, compared to $134,497 statewide.
Regional Analysis
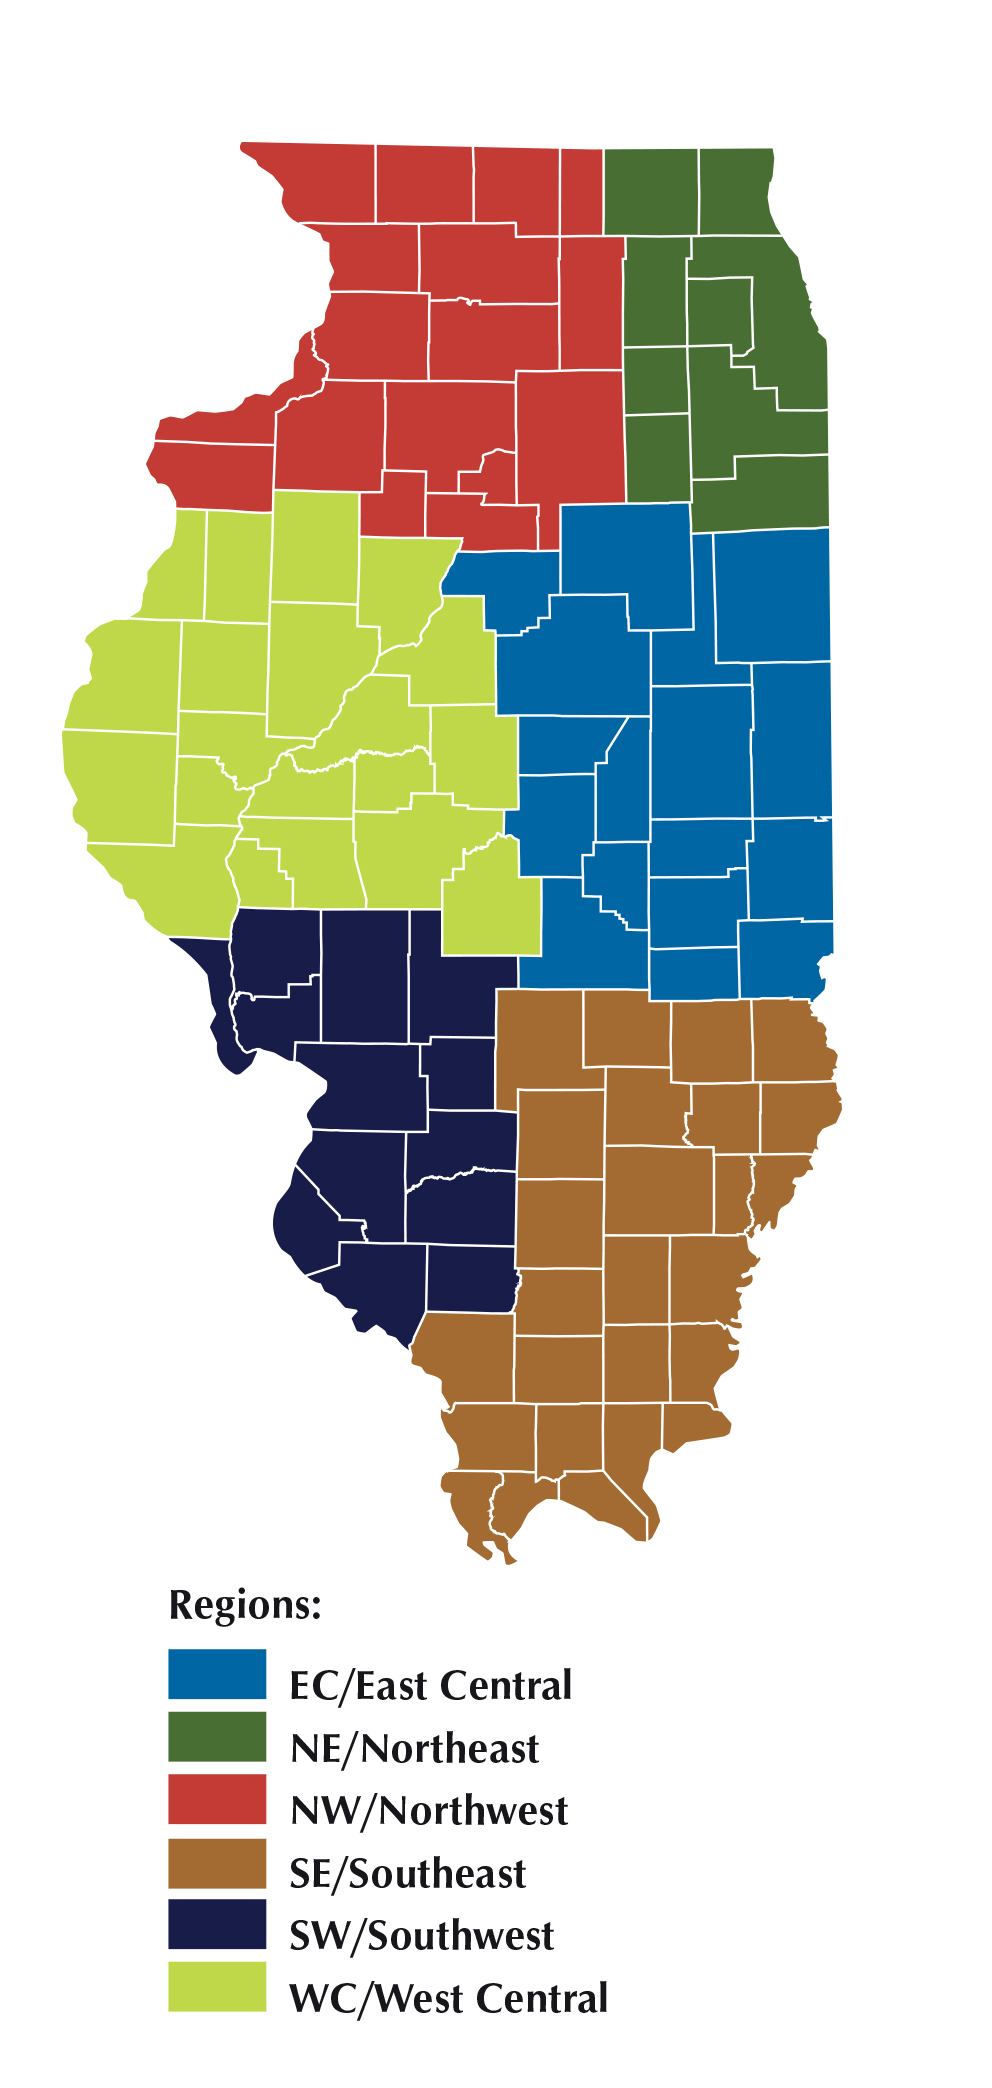
For the regional analysis, we combined assistant principals and principals (see Table 4). The Northeast Region of the state (Cook, DuPage, Grundy, Lake, Kane, Kankakee, Kendall, McHenry, and Will) drives the numbers even without, as noted above, counting Chicago Public Schools in this analysis. Both the state’s population and the cost of living are reflected in the Northeast’s numbers compared to the rest of Illinois.
The regions (see Figure 1) for the Journal’s Administrator Salaries series date back to the first installment, in 1997, when data was self-reported and the number of respondents was a few dozen. For much of the state, the regions are data comparable (see Table 4). But the Northeast data is different from the rest. For principals, the difference is starkest when comparing the Northeast directly with the other five regions combined. In 2020, the Northeast counted 2,766 principals. The rest of the state tallied 1,909. The average salary for principals in the Northeast is $136,789. This is higher by almost $19,000 than the next highest average, from the Northwest. Separate out the Northeast from the rest of the state and the difference is even more noticeable: the state’s average principal salary without the Northeast is $108,184.
As expected, all of the regional average salaries for principals increased over the three years of data in this analysis.
As a whole, the salary trends for 2018 through 2020 are consistent, be it through the years, across the state, and per region. Boards of education are encouraged to look at the data relevant to their situation when planning administrative personnel changes and salaries.
Theresa Kelly Gegen is Editor of the Illinois School Board Journal.